European refineries were included in the European Emission Trading Scheme (ETS) in 2013. Carbon prices have increased significantly since the start of Phase-4 of the ETS in 2014. At current levels, they add enormously to the economic benefit of being energy and hydrogen efficient. Has this produced an acceleration of the pace at which European refineries are reducing emissions?
Europe is currently in the fourth phase of the Emission Trading Scheme, which started in 2021 and will last until 2030. At the beginning of Phase-3 in 2013, European refineries started receiving free emission allowances based on using “pacesetting” refineries as benchmarks. This meant that refineries need to buy additional allowances based on their gap versus the benchmark, plus an incremental amount for production of electricity. We will show that the average refinery buys approximately 35% of its allowances.
Unused carbon permits can be traded, so the marginal value of increasing energy efficient and reduce carbon emissions is augmented by the carbon costs. Carbon prices remained low or moderate until 2020, but have increased substantially with the tightening of carbon markets at the beginning of Phase-4 in 2021. Have European refineries become more efficient since 2013?
Data on the carbon emissions of refineries are now available for the full year 2023. Their interpretation is quite uncertain, but it looks like the improvement over a 15 year period has been of the order of 5-10%. Given the currently high focus on carbon intensity and the fact high carbon prices are a fairly recent phenomenon, it is reasonable to expect an acceleration.
Between 2008 and 2023, the carbon emissions of refineries under EU ETS has decreased by 15%. However, the volume of crude processed reduced by 16%, such that on a “per barrel basis” the carbon intensity in 2023 was actually 1% higher than in 2008 (30.2kgCO2/bbl vs 30.0kgCO2/bbl).
Verified emissions and carbon intensity of EU refineries
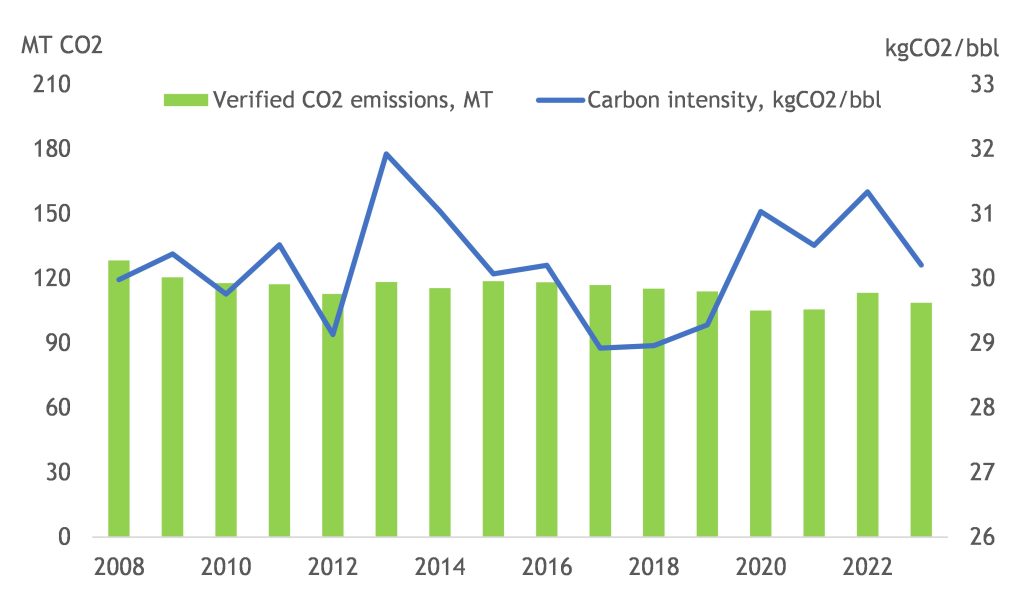
Source: own analysis based on EU ETS verified emissions
Looking at the trends, it is fairly evident that the carbon intensity is lower at times of high margins and vice versa. This is explained by the fact high margins call more marginal capacity to supply the market. This is normally incremental capacity at simpler refineries, so it has a lower carbon intensity. When margins are high and refineries operate at higher throughput their energy efficiency is also higher.
In 2022 refining margins reached unprecedented levels and hydroskimming margins were also strongly positive. In theory, the carbon intensity of refineries should have fallen relative to 2021. The increase is explained by the very high gas prices, which caused refineries to use more carbon intensive fuels and to use LPG or naphtha for hydrogen generation.
Therefore, the trends of Figure-1 would seem to indicate that refineries are still operating at levels of efficiency that are comparable to 10-15 years ago or that the improvements are still low enough to be hidden by the impact of other factors.
Figure-1 oversimplifies the problem in the fact that it does not take into account the impact of refinery upgrades or closures. Many refineries have closed in Europe since 2008, while some others have made significant changes resulting in large increases (or sometimes reductions) of their carbon emissions. Through investment and rationalization cycles, refining capacity tends to become more complex and more carbon intensive (at constant energy efficiency). Isolating the subset of refineries that have been under ETS continually since 2008 and did not make significant changes to their configurations or capacity, provides a fairer assessment as to whether European refineries have improved their efficiency. The results are shown in Figure-2, according to which emissions have reduced slightly.
Verified emissions of refineries continually in operations between 2008 and 2023
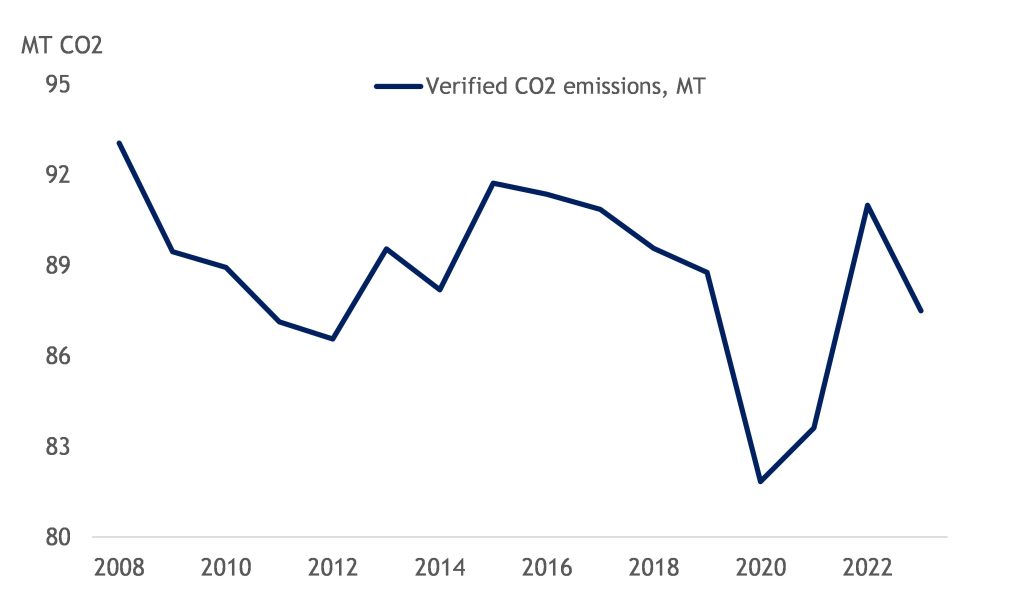
Source: own analysis based on EU ETS verified emissions
The main issue with this approach is that crude oil processing statistics are available at the country level, so the carbon intensity is not really known. It can be deemed based on crude distillation capacity and an assumed level of utilization, but this does not take into account the fact that utilization is higher when margins are higher. The results can be interpreted considering that margins were high in 2008, 2015 and 2023. In these three years refineries would be operated at close to their technical capacities. Based on this, it would seem that EU refineries have, on average, improved their carbon efficiency by about 6%.
The estimates are still quite simplified. For the results to be rigorous, emissions should capture Scope-1 and Scope-2 emissions, but the data do not allow doing this. One of the most carbon intensive refineries in the sample is known to be selling electricity as a product. Some very complex refineries were found to have lower carbon intensity than would have been expected, probably because they buy hydrogen and/or electricity. Some refineries are interfaced with Combined Heat and Power plants that supply them with steam and electricity, but the associated carbon emissions are in different accounts. However, the sample is large enough to be considered representative of the industry average.
For certain years, the results needs to be interpreted as a way of confirming the validity of the assessment. For example, in 2012 refining margins were higher than in 2011 and 2013, but emissions were lower. This is explained by the temporary shutdown of the Ingolstadt refinery after the Petroplus’ bankruptcy, a factor that accounts for 0.4MT of CO2. In 2012 there were also a handful of refineries in the sample showing much lower carbon emissions than in 2021, perhaps because they had turnaround maintenance or accidents. Margins recovered in 2014 but emissions remained low. This was a year of two halves, with very low margins until the summer and very strong margins towards the end of the year. The reduction from 2022 to 2023 can be explained by falling natural gas prices and gas retaking its role as the lowest cost feed to produce hydrogen.
What are the average carbon costs?
With carbon prices raising from an average of only $7.50/tonne between 2013 and 2017, to approximately $90/tonne in 2023, carbon costs have increased.
Until 2012 refineries were receiving free emissions based on “grandfathering”. The concept of free emissions based on “efficient benchmarks” was introduced in 2013. Between 2013 and 2020, refineries were given 29.5kgCO2/CWT of free emission permits, whereas the average refinery was emitting 35.0kgCO2/CWT, i.e. 19% more. A subsequent study found that the average refinery in 2016/17 was emitting 32.6kgCO2/CWT, i.e. 11% more than the free allocations. Because of the need to buy emission permits also with respect of auto-production of electricity, in 2013 the average refinery emitted 1.28x its allocation of free emissions, so it had to purchase an amount equivalent to 28% of the allocation. With higher margins between 2015 and 2019, purchases increased to 40-45%.
Free allocations and purchased emissions
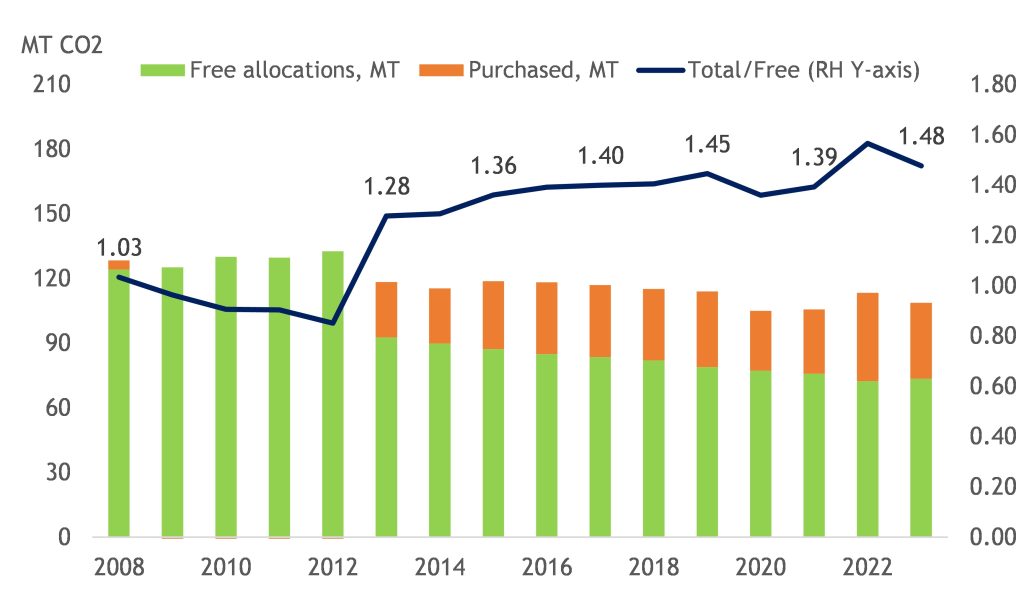
Source: own analysis based on EU ETS verified emissions
In 2021, Phase 4 began. European refineries had been found to have improved their carbon efficiency slightly (from 35.0kgCO2/CWT to 32.6kgCO2/CWT). Free allocations were reduced by somewhat more, i.e. from 29.5kgCO2/CWT to 22.8kgCO2/CWT. Thus, the need to buy emissions increased further, even though initially this was offset by lower throughput during the pandemic. As of 2023, the average European refinery had to buy an incremental 48%.
Carbon costs have tracked the carbon price to reach $0.88/bbl in 2023. Currently, carbon prices are lower. On current trends, it can be expected that average carbon costs in 2024 will be in the region of $0.70/bbl.
Carbon costs
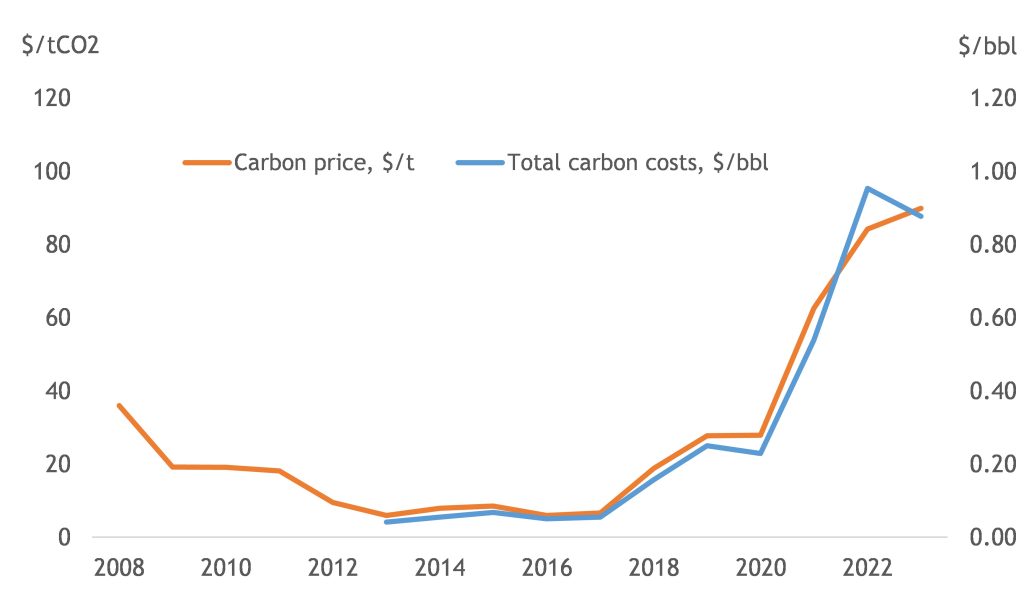
Source: own analysis based on EU ETS verified emissions and carbon from the eex website
The total carbon bill of European refineries in 2023 is estimated at $3.1bn and should be in the region of $2.5bn in 2024. This excludes indirect “Scope-2” costs, i.e. those that are incurred when carbon costs are added to the price of purchased utilities such as electricity and hydrogen.
© Midhurst Downstream, 2024
If you would like to engage with us about this topic or give us feedback to improve our work, please write to us at: mail@midhurstdownstream.com